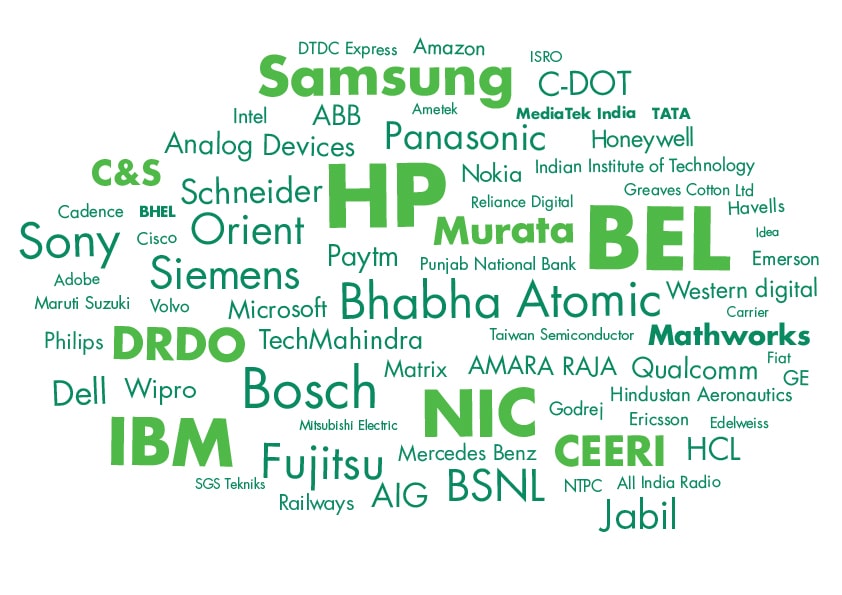
Who visits ITW@Home? What are their profiles? Which cities or countries do they visit from? What do they think about ITW@Home?
Since ITW@Home is a digital platform, we could do a very high degree of analysis of our visitor database and their behavioural patterns. Plus, thanks to some surveys that we conducted we managed to receive direct feedback too.
TABLE OF CONTENTS
- At-a-glance Statistics
- Audience Profile: Type of Firm
- Audience Profile: Job Profile (and further breakdown of Profiles)
- Audience Profile: List of Few Leading Corporates & MNCs
- Geographical Profile of Visitors: India vs International
- Geographical Profile of Visitors: International Regions
- Geographical Profile of Visitors: States of India
- Feedback: Comparing ITW@Home vs Traditional Event
- Feedback: Overall Rating of ITW@home
- Audience Profile: List of Enterprise Firms
Plus, explanation of Audience Job Profile
| AT-A-GLANCE STATS OF LAST EDITION | |
| Total Unique Visitors: | 12,500- plus |
| % Visitors Who Returned: | 33.40% |
| Average Visits per e-Booth: | 125-plus |
| % Visitors Outside India: | 15.36% |
| Panel Discussions: | 5 |
| Tech Talks: | 91 |
| Industry Experts as Speakers: | 97 |
| Delegates for Conferences: | 2300- plus |
| % of Delegates Attending Expo: | 77.50% |
| Exhibitors: | 85 |
*EXPLANATION OF AUDIENCE PROFILES
CREATORS OF TECH
Those who do R&D, design, develop new tech solutions. From junior design engineer to Software Project Manager to the CTO–anyone who’s involved in development is a CREATOR for us.
MANUFACTURERS OF TECH
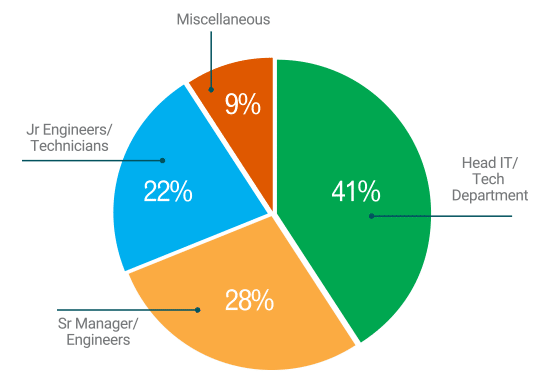
DEPLOYERS OF TECH
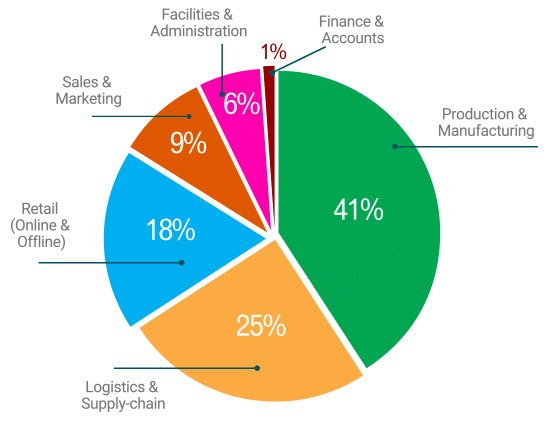
PROFITEERS OF TECH
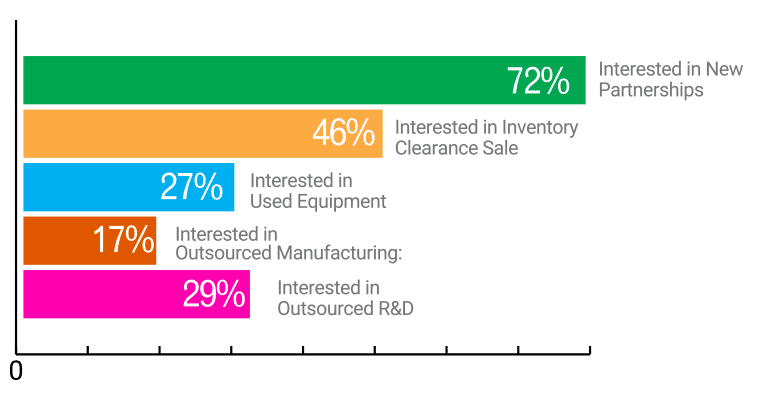
ENTREPRENEURS OF TECH
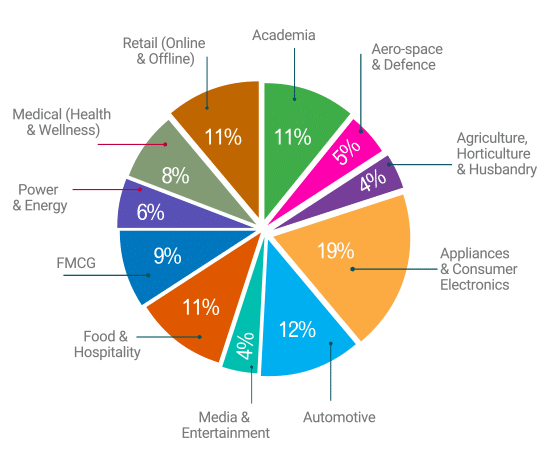
AUDIENCE PROFILE: TYPE OF FIRM
What types of firms did visitors to ITW@Home’s last edition belong to?
Academia: 11%
Aero-space & Defence: 5%
Agriculture, Horticulture & Husbandry: 4%
Appliances & Consumer Electronics: 19%
Automotive: 12%
Media & Entertainment: 4%
Food & Hospitality: 11%
FMCG: 9%
Power & Energy: 6%
Retail (Online & Offline): 8%
Medical (Health & Wellness): 11%
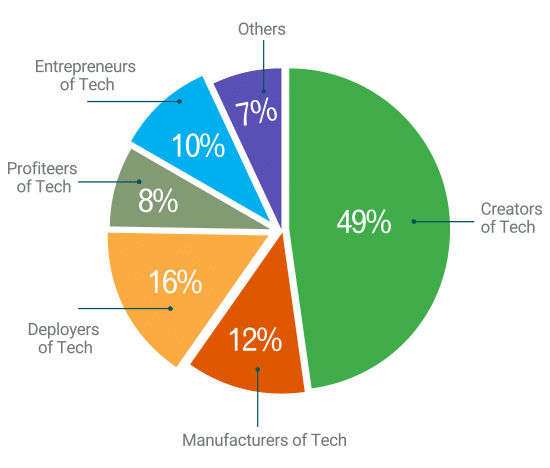
AUDIENCE PROFILE: JOB PROFILE
What was the broad profile of the visitors?
Creators of Tech: 49%
Manufacturers of Tech: 12%
Deployers of Tech: 16%
Profiteers of Tech: 8%
Entrepreneurs of Tech: 10%
Others: 7%
NOTE: The primary focus of the last edition was on Creators and Entrepreneurs. As the show expands, promotions to other segments will increase–and visitors from the other segments will increase.
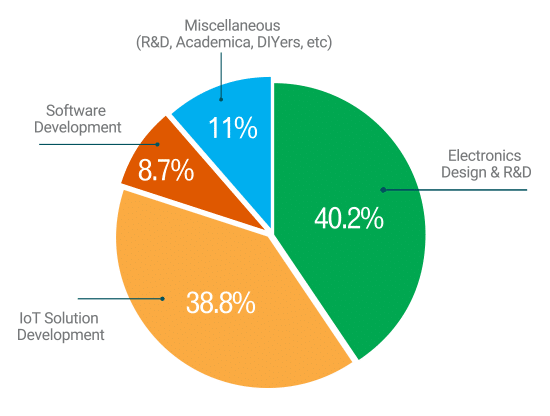
AUDIENCE PROFILE: CREATORS OF TECH
What’re the types of Creators who visited ITW@Home?
Electronics Design & R&D: 40.2%
IoT Solution Development: 38.8%
Software Development: 8.7%
Miscellaneous (R&D, Academica, DIYers, etc): 11%
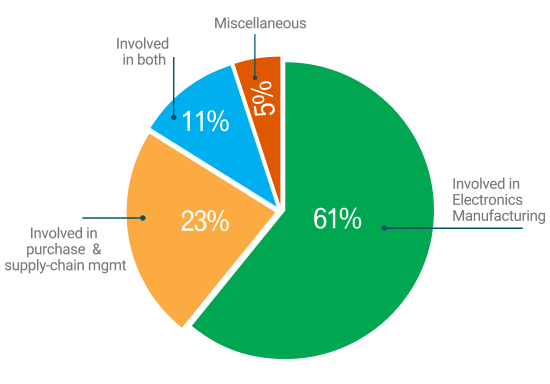
AUDIENCE PROFILE: MANUFACTURERS OF TECH
What’re the type of Manufacturers who visited ITW@Home?
Involved in Electronics Manufacturing: 61%
Involved in purchase & supply-chain mgmt: 23%
Involved in both: 11%
Miscellaneous: 5%
AUDIENCE PROFILE: DEPLOYERS OF TECH
Head IT/Tech Department: 41%
Sr Manager/Engineers: 28%
Jr Engineers/Technicians: 22%
Miscellaneous: 9%
AUDIENCE PROFILE: PROFITEERS OF TECH
Production & Manufacturing: 41%
Logistics & Supply-chain: 25%
Retail (Online & Offline): 18%
Sales & Marketing: 9%
Facilities & Administration: 6%
Finance & Accounts: 1%
AUDIENCE PROFILE: ENTREPRENEURS OF TECH
Interested in New Partnerships: 72%
Interested in Inventory Clearance Sale: 46%
Interested in Used Equipment: 27%
Interested in Outsourced Manufacturing: 17%
Interested in Outsourced R&D: 29%
GEOGRAPHICS DEMOGRAPHICS
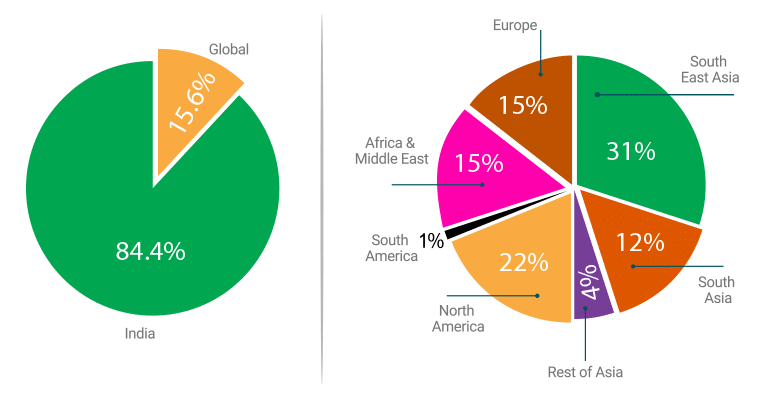
International Vs India
Global: 15.6%
India: 84.4%
Global Audience Distribution
South East Asia: 31%
South Asia: 12%
Rest of Asia: 4%
North America: 22%
South America: 1%
Africa & Middle East: 15%
Europe: 15%
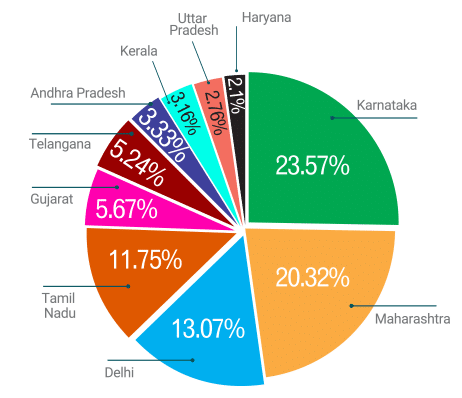
India’s State-wise distribution
Andhra Pradesh 3.33%
Arunachal Pradesh 0.02%
Assam 0.27%
Bihar 0.37%
Chandigarh 0.30%
Chhattisgarh 0.32%
Dadra and Nagar Haveli 0.10%
Daman and Diu 0.08%
Delhi 13.07%
Goa 0.23%
Gujarat 5.67%
Haryana 2.01%
Himachal Pradesh 0.12%
Jammu & Kashmir 0.15%
Jharkhand 0.28%
Karnataka 23.57%
Kerala 3.16%
Madhya Pradesh 1.11%
Maharashtra 20.32%
Manipur 0.10%
Meghalaya 0.05%
Mizoram 0.02%
Nagaland 0.03%
Odisha 0.80%
Puducherry 0.22%
Punjab 0.91%
Rajasthan 1.60%
Tamil Nadu 11.57%
Telangana 5.24%
Tripura 0.02%
Uttar Pradesh 2.76%
Uttarakhand 0.42%
West Bengal 1.80%
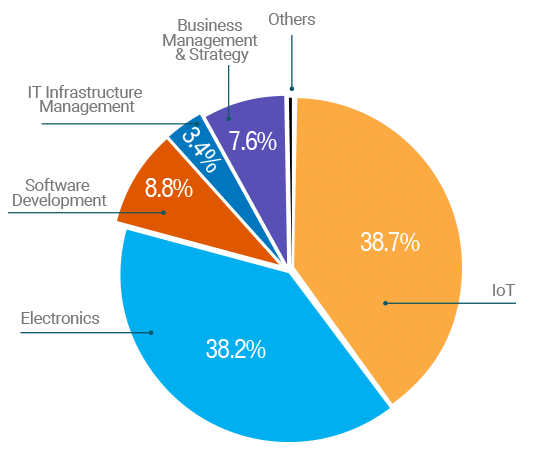
VISITORS’ SURVEY
Which topic is closest to your heart?
- Electronics
- IoT
- Software Development
- IT Infrastructure
- Management
- Business Management &
- Strategy
- Others
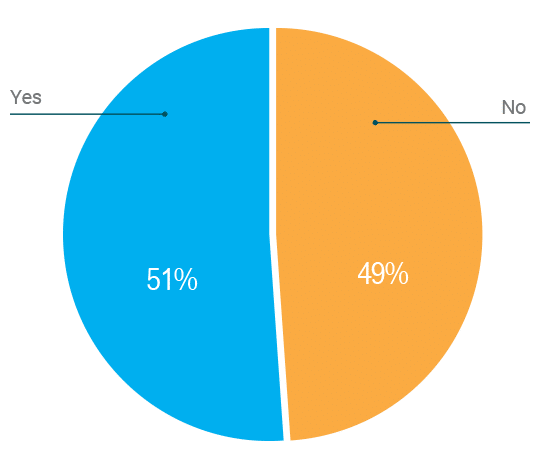
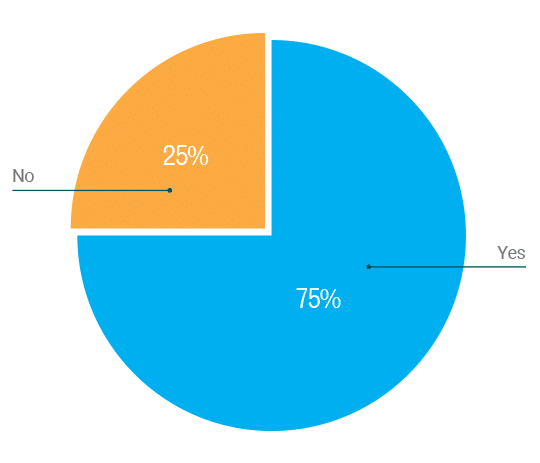
Did you visit any of the earlier editions of India Technology Week @Home?
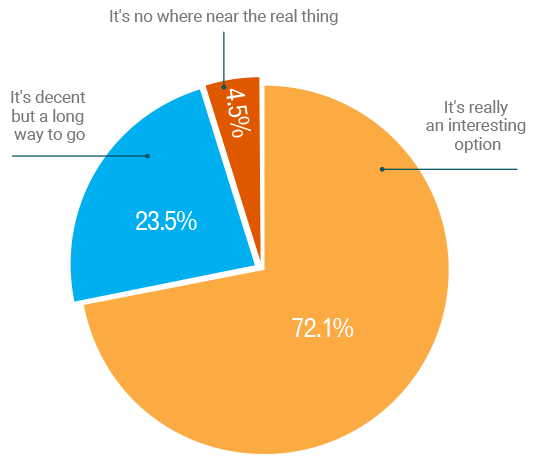
How do you like the concept of an Online Only Event?
- It’s really an interesting option
- It’s decent but a long way to go
- It’s no where near the real thing
SURVEY: PURCHASE MANAGERS
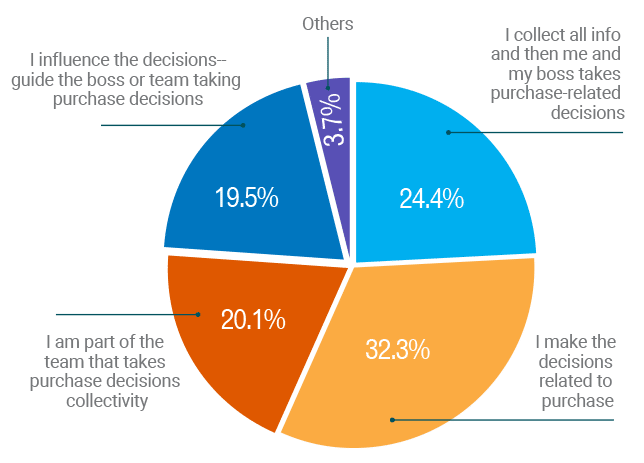
What describes your ROLE the best?
- I make the decisions related to purchase
- I collect all info and then me and my boss takes purchase-related decisions
- I am part of the team that takes purchase decisions
collectivity - I influence the decisions– guide the boss or team taking
purchase decisions - Others
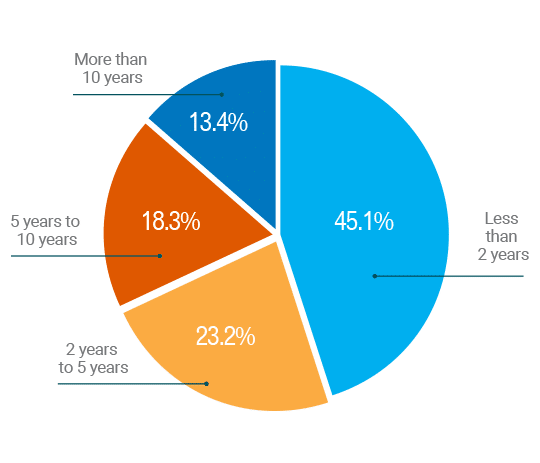
Since how long have you been in a Purchase-related role?
- Less than 2 years
- 2 years to 5 years
- 5 years to 10 years
- More than 10 years
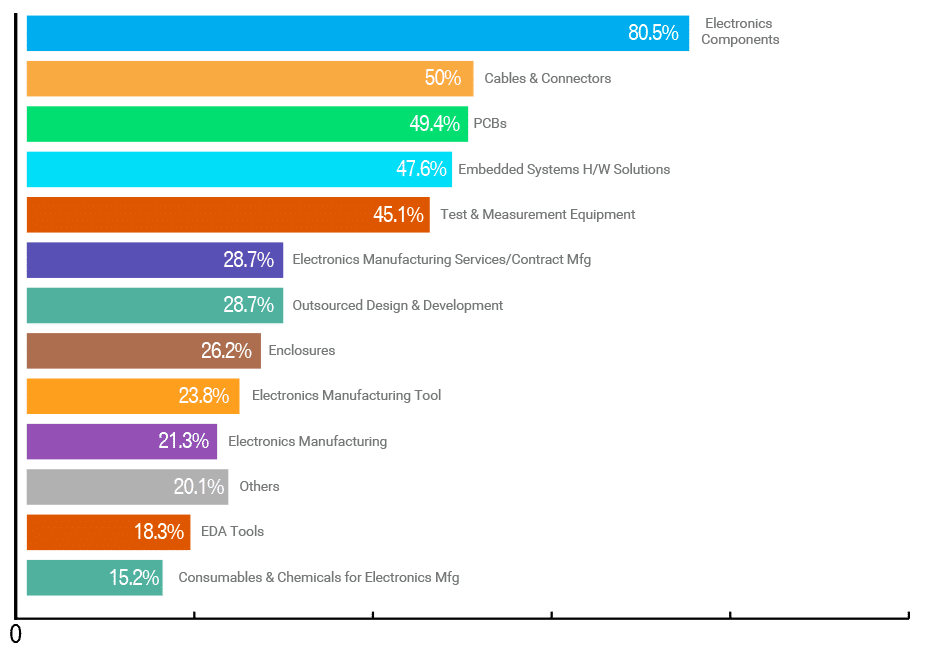
Which of these products or services do you regularly purchase?
Are you facing a challenge in sourcing under current conditions?
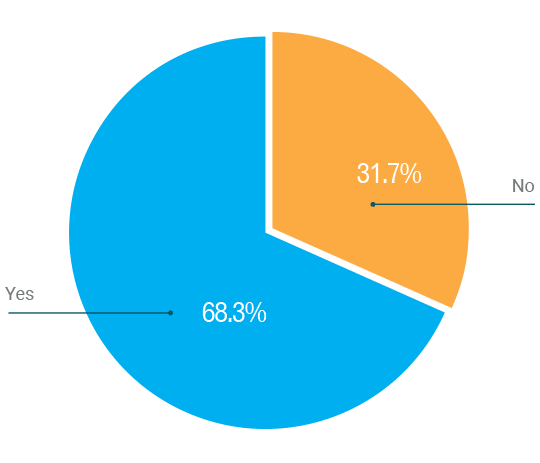
Are you looking for new suppliers in such a condition?
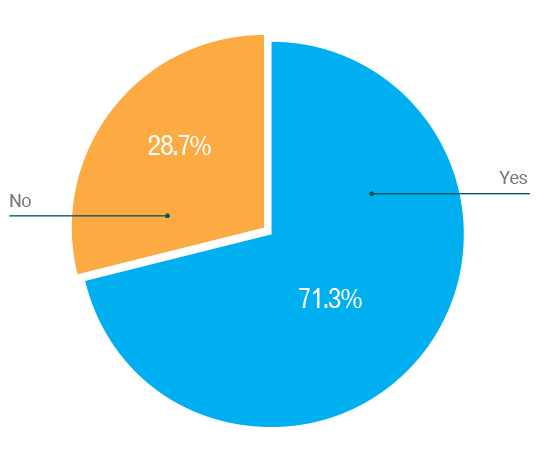
Do you actively look for new vendors?
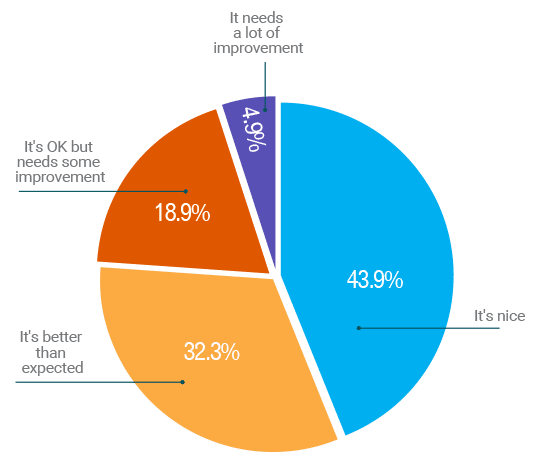
How would you rate ITW@Home as a platform to help you connect with
AUDIENCE PROFILE: LIST OF ENTERPRISE FIRMS
